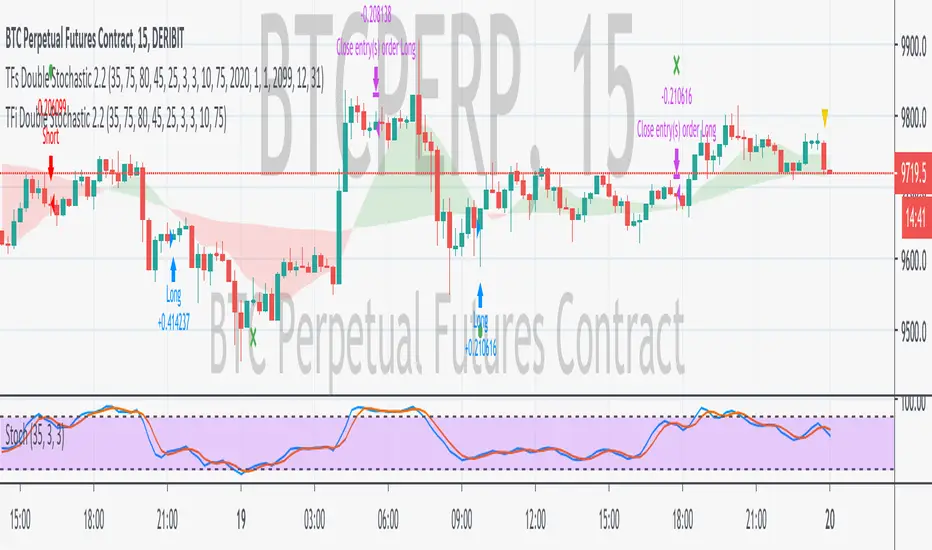
TFi Double Stochastic StudyThe Study script uses Stochastic indicators for entry and exit a position.
The entry and exit points are visualized in the chart via green arrows and crosses; the position follows the exact behavior of the strategy script.
The study also creates alerts, which follow the exact position of the entry/exit markers.
How to use
The Study works with most timeframes and instruments.
I'm also providing a "strategy" version of this Study, which can be used to backtest the strategy.
List of parameters
"Stochastic Length" ... Number of bars for Stochastic indicators
"Stochastic Overbought" ... Stochastic overbought level
"Stochastic Overbought Down Trend" ... Stochastic overbought level for down trends
"Stochastic Oversold Up Trend" ... Stochastic oversold level for up trends
"Stochastic Oversold" ... Stochastic oversold level
"Stochastic Smooth K" ... Stochastic K smoothing
"Stochastic Smooth D" ... Stochastic D smoothing
"Stochastic Confirmed" ... Enable to confirm the indicator value within the current bar
"MA Filter Enabled" ... Enable an additional filter for entering a position; the entries only follow the overall trend
"MA Fast Period" ... Fast filter period
"MA Slow Period" ... Slow filter period
List of alerts
Entry Long' ... Enter long position
'Entry Short' ... Enter short position
'Exit Long/Short' ... Exit long/short position
How to access
This Study is a "Invite Only" script. Please use the link below or send me a message via Tradingview to obtain access to the strategy and study script.
For enabling the script in your Tradingview chart window, click on "Indicators" and select "Invite-Only Scripts".
"the script" için komut dosyalarını ara
TFs Double Stochastic StrategyThe Strategy script uses Stochastic indicators for entering and exiting a position.
How to use
The strategy works with most timeframes and instruments.
I'm also providing a "study" version of this script, which can be used for automation of the strategy via alerts.
The script is using a default commission of 0.075% which reflects Bitmex' Taker-Fees. This is just a default and can be modified in the strategy settings for each instrument individually.
List of parameters
"Stochastic Length" ... Number of bars for Stochastic indicators
"Stochastic Overbought" ... Stochastic overbought level
"Stochastic Overbought Down Trend" ... Stochastic overbought level for down trends
"Stochastic Oversold Up Trend" ... Stochastic oversold level for up trends
"Stochastic Oversold" ... Stochastic oversold level
"Stochastic Smooth K" ... Stochastic K smoothing
"Stochastic Smooth D" ... Stochastic D smoothing
"MA Filter Enabled" ... Enable an additional filter for entering a position; the entries only follow the overall trend
"Fast Period" ... Fast filter period
"Slow Period" ... Slow filter period
"Backtest ..." ... Backtest timeframe; area outside this timeframe will be grayed out
How to access
This strategy is a "Invite Only" script. Please use the link below or send me a message via Tradingview to obtain access to the strategy and study script.
For enabling the script in your Tradingview chart window, click on "Indicators" and select "Invite-Only Scripts".

TFs Pivot Reversal StrategyThe Pivot Reversal strategy script uses pivot points to create a support and resistance level; based on this levels the strategy creates virtual stop-market orders to catch the trend if the price is crossing the pivot lines.
A configurable trailing-stop and stop-loss is being used to exit an open position.
How to use
The strategy works with all timeframes; the current chart setting is using a 15min timeframe. The strategy enters about 10 trades per day, depending on the used settings.
I'm also providing a "study" version of this strategy, which can be used to automate the strategy by using webhooks for instance.
The script is using a default commission of 0.075% which reflects Bitmex' Taker-Fees. This is just a default and can be modified in the strategy settings for each instrument individually.
How to access
This strategy is a "Invite Only" script. You can can subscribe or purchase the strategy ; please use the link below or send me a message via Tradingview to obtain access to the strategy and study script.
For enabling the script in your Tradingview chart window, click on "Indicators" and select "Invite-Only Scripts".
Full list of parameters:
"Pivot Left Bars" ... Number of bars on the left of the pivot point - used for pivot/peak detection
"Pivot Right Bars" ... Number of bars on the right of the pivot point - used for pivot/peak detection
"Entry Offset " ... Entry price offset after crossing pivot line (in %)
"Trailing Activation Level " ... Trailing stop activation level above/below average price (in %)
"Trailing Offset " ... Trailing stop price (in %)
"Stop Loss " ... Absolute stop-loss (in %)
"Capital Risk Factor " ... Capital risk factor (in %)
"Margin / Leverage " ... Optional leverage factor which can be used to leverage position (in %)
"Backtest ..." ... Backtest timeframe; area outside this timeframe will be grayed out
I'm looking forward to any feedback, reviews or change requests!

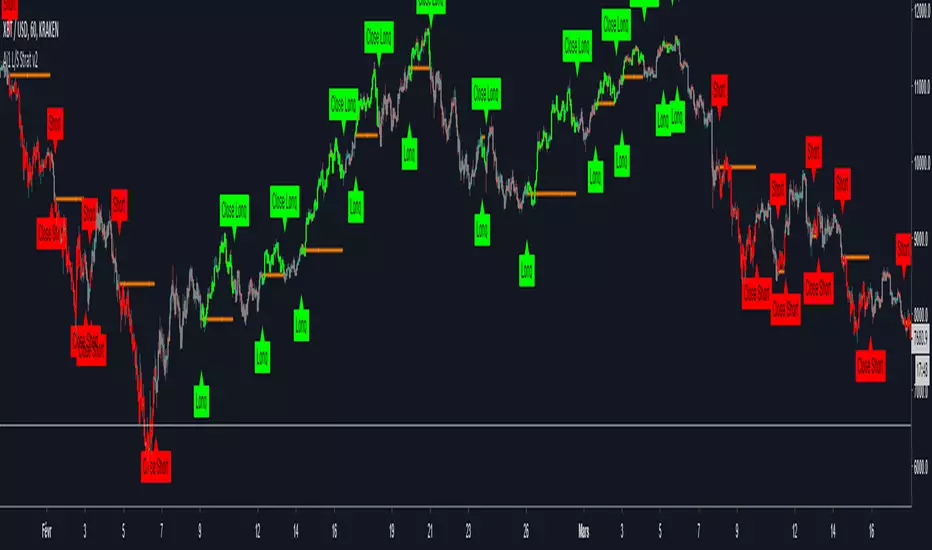
All-in-One Solutions - Long/Short StrategyHello,
I always had in mind that a single strategy cannot be profitable on multiple symbols or commodities ...
This is why I created this strategy where different settings can be applied for each of the symbol you use to trade.
For each symbol you trade, the strategy will ask you for 9 parameters to play with. I already filled the settings for several symbol but it is up to you to find the best 9 parameters for the symbol you like to trade and the time frame you usually use (I often use it in 1H).
The script does not allow any repaint and the Trading view back-testing system is reliable.
For exemple if you like to trade ETH/USD, you have to play with the 9 parameters and find the best net profitability calculated by the back-testing of Trading View.
Here is a screenshot of the setting page of the strategy :
imgur.com
You can find also below the link to all the previous scripts I published :
fr.tradingview.com
PS: please do not ask me to add in this strategy an alert system as Trading View does not allow to implement alerts in strategies script (because strategies scripts run on you computer, where alerts are located on TV servers).
Nevertheless if there is a demand, I can develop an indicator where you can implement the best settings found by you in this strategy and use it as an alerts script.
Please ask me for access, I grant free 1 week full access to all my indicators.
Have fun !
Last Update:
- I added the bar color in order to see on the chart the Long and Short positions
- I added the panels Open and Close positions to be visible on the chart
- I added an horizontal line on the chart when a position is open in order to see on the chart if position is positive or negative
- I modified the parameters description in order to make it more clear
I filled nice settings for 5 cryptos. If you find suitable settings for other commodities, please share the parameters into the comment in order to share with the community.
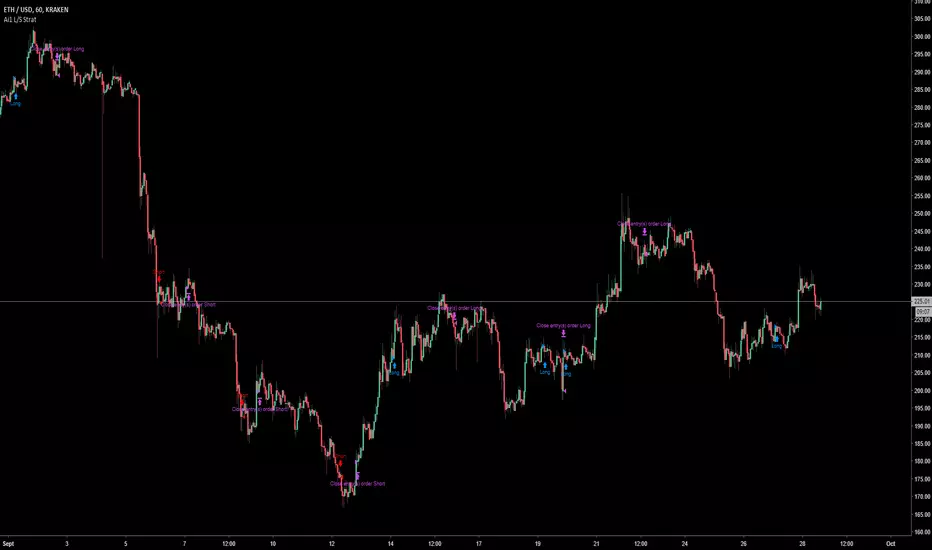
All-in-One Solutions - Long/Short StrategyHello,
I always had in mind that a single strategy cannot be profitable on multiple symbols or commodities...
This is why I created this strategy where different settings can be applied for each of the symbol you use to trade.
For each symbol you trade, the strategy will ask you for 9 parameters to play with. I already filled the settings for several symbol but it is up to you to find the best 9 parameters for the symbol you like to trade and the time frame you usually use (I often use it in 1H).
The script does not allow any repaint and the Trading view back-testing system is reliable.
For exemple if you like to trade ETH/USD, you have to play with the 9 parameters and find the best net profitability calculated by the back-testing of Trading View.
Here is a screenshot of the setting page of the strategy :
imgur.com
You can find also below the link to all the previous scripts I published :
fr.tradingview.com
PS: please do not ask me to add in this strategy an alert system as Trading View does not allow to implement alerts in strategies script (because strategies scripts run on you computer, where alerts are located on TV servers).
Nevertheless if there is a demand, I can develop an indicator where you can implement the best settings found by you in this strategy and use it as an alerts script.
Please ask me for access, I grant free 1 week full access to all my indicators.
Have fun !
GTI Buy/SellGTI Buy/Sell – Precision Reversal & Trend Confirmation Tool
The GTI Buy/Sell is an indicator designed to identify potential trend reversals and confirm ongoing trends with precision.
What It Does
This indicator generates Buy and Sell signals based on dynamic positioning relative to price action. A Buy signal is printed when the GTI line closes below the candle’s close, indicating a potential transition from a bearish to bullish phase. A Sell signal occurs when the GTI line appears above the candle’s close, suggesting a possible bearish reversal.
The GTI Buy/Sell doesn’t repaint and provides clear, actionable signals based on live market conditions.
How It Works
GTI Buy/Sell combines Average True Range (ATR) for volatility filtering, Smoothed Moving Averages (RMA), Simple Moving Average (SMA), and Exponential Moving Average (EMA) to generate a responsive trend-following structure.
Rather than using static crossovers, the script evaluates price interaction with multiple weighted moving averages and ATR thresholds to identify exhaustion points and turning moments. These calculated confluences enhance signal quality and reduce false positives.
Strategy & Usage Tips
Combine with a 38-period SMA: When the GTI prints a Buy signal and price is above the 38 SMA, it reinforces bullish continuation or reversal. Similarly, a Sell signal with price under the 38 SMA supports a bearish outlook.
Use with VWAP for Validation: In high-liquidity assets such as indices, pairing GTI with VWAP helps identify institutional support/resistance zones to validate the signal strength.
Confluence with GTI Trend: For best results, use this indicator alongside our GTI Trend, which analyzes broader trend context across timeframes. This combination allows traders to align micro signals with macro market direction.
Recommended Assets
GTI Buy/Sell performs best on assets with significant intraday volatility such as:
NASDAQ
US30 / Dow Jones
S&P 500
Gold (XAUUSD)
Brazilian Mini Index (WIN)
However, it can be applied to any instrument where meaningful trend behavior and price movement are present.

coinbot_ICT_Unicorn(AUTOTRADE)1. 🎯 핵심 기능: 자동매매 신호 전송 (Webhook)
이 스크립트는 매매 신호가 발생할 때마다, 사용자가 '자동매매 설정(Autotrade Settings)'에 입력한 값들을 조합하여 구체적인 JSON 메시지를 생성하고 alert() 함수를 통해 웹훅으로 전송합니다.
입력 설정: user_id, exchange(거래소), leverage(레버리지), capital_percent(투입 시드 %), sl_percent(손절 %), 그리고 3단계 분할 익절(tp1_price_percent, tp1_qty_percent 등) 설정을 입력받습니다.
신호 종류:
ENTRY (진입): 매수(buy) 또는 매도(sell) 신호가 발생하면, 위 모든 설정값을 포함한 진입 명령을 보냅니다.
CLOSE (손절): 전략의 내부 로직에 의해 손절가에 도달하면(slAlertTick), 포지션을 종료하라는 신호를 보냅니다.
TAKE_PROFIT (익절): 목표가에 도달하면(tpAlertTick), 설정된 물량만큼 익절하라는 신호를 보냅니다.
2. 📈 작동 원리: "ICT 유니콘" 매매 전략
이 스크립트의 진입 로직은 ICT(Inner Circle Trader) 개념 중 하나인 **'유니콘 모델'**을 따릅니다.
구성 요소 식별:
Breaker Block (BB): '브레이커 블록'을 식별합니다. 이는 특정 고점/저점을 만든 후 그 방향으로 가지 못하고 반대 방향으로 돌파(Break)된 오더 블록(Order Block)입니다.
Fair Value Gap (FVG): '공정 가치 갭' (가격 불균형 영역)을 식별합니다.
핵심 진입 신호 (Unicorn): 이 전략의 핵심 진입 조건은 **Breaker Block(BB)과 Fair Value Gap(FVG)이 중첩(Overlap)**되는, 소위 '유니콘'이라 불리는 강력한 지지/저항 영역이 발생하는 것입니다.
Long (매수) 진입:
가격이 하락하며 **'하락형 브레이커 블록(Bearish Breaker Block)'**을 만듭니다.
이후 가격이 상승 돌파하며 이 브레이커 블록 영역과 중첩되는 **'상승형 FVG(Bullish FVG)'**를 생성합니다.
이 중첩 영역(FVG-BB Overlap)이 바로 매수 진입의 근거가 됩니다. (코드가 dbgRequireRetracement 설정에 따라 FVG로의 되돌림을 기다리거나 즉시 진입 신호를 보냅니다.)
Short (매도) 진입:
가격이 상승하며 **'상승형 브레이커 블록(Bullish Breaker Block)'**을 만듭니다.
이후 가격이 하락 돌파하며 이 브레이커 블록 영역과 중첩되는 **'하락형 FVG(Bearish FVG)'**를 생성합니다.
이 중첩 영역이 매도 진입의 근거가 됩니다.
3. 📊 부가 기능
시각화: 차트 상에 FVG 영역과 Breaker Block 영역을 박스로 그려주어(설정에 따라 표시/숨김 가능) 매매 근거를 시각적으로 확인할 수 있게 합니다.
백테스팅 대시보드: 차트 우측 상단(기본값)에 이 전략의 누적 성과(총 진입 횟수, 승/패, 승률, 총수익률)를 보여주는 대시보드를 표시합니다.
요약
이 스크립트는 **"Breaker Block과 FVG의 중첩(유니콘 모델)"**을 유일한 진입 조건으로 사용하는 매우 구체적인 ICT 전략입니다. 이 조건이 충족되면, 사용자가 미리 설정한 상세한 리스크 관리 값들을 담아 자동매매 봇으로 즉시 실행 가능한 주문 신호를 전송하는 '올인원(All-in-One)' 전략 스크립트입니다.
요청하신 대로, 해당 지표 요약본을 영어로 번역하여 제공합니다.
This script is an automated trading (Autotrade) strategy signal generator based on the ICT "Unicorn" trading model.
As the "AUTOTRADE" in its name implies, the core purpose of this indicator is to detect specific conditions on the chart and send JSON-formatted order signals (webhooks) to an external automated trading bot.
Here are the core mechanics and features of this script:
1. 🎯 Core Feature: Automated Signal Transmission (Webhook)
Whenever a trade signal occurs, this script generates a specific JSON message by combining the values entered by the user in the "Autotrade Settings" and sends it via webhook using the alert() function.
Input Settings: It takes inputs for user_id, exchange, leverage, capital_percent (equity %), sl_percent (stop loss %), and settings for 3-stage split take-profits (e.g., tp1_price_percent, tp1_qty_percent).
Signal Types:
ENTRY: When a "buy" or "sell" signal occurs, it sends an entry command including all the settings above.
CLOSE (Stop-Loss): If the price hits the stop loss according to the strategy's internal logic (slAlertTick), it sends a signal to close the position.
TAKE_PROFIT: When a profit target is reached (tpAlertTick), it sends a signal to take profit on the specified quantity.
2. 📈 How It Works: The "ICT Unicorn" Strategy
The script's entry logic follows the "Unicorn Model," one of the concepts from ICT (Inner Circle Trader).
Identifying Components:
Breaker Block (BB): It identifies a "Breaker Block." This is an Order Block that, after creating a specific high/low, fails to continue in that direction and is instead broken through in the opposite direction.
Fair Value Gap (FVG): It identifies a "Fair Value Gap" (a price imbalance area).
Core Entry Signal (The Unicorn): The core entry condition for this strategy is the overlap of a Breaker Block (BB) and a Fair Value Gap (FVG), which creates a powerful support/resistance zone known as the "Unicorn."
Long Entry:
Price moves down, creating a "Bearish Breaker Block."
Subsequently, price breaks upward, creating a "Bullish FVG" that overlaps with this Breaker Block area.
This overlapping area (FVG-BB Overlap) becomes the basis for the long entry. (Depending on the dbgRequireRetracement setting, the code either waits for a retracement to the FVG or sends an immediate entry signal.)
Short Entry:
Price moves up, creating a "Bullish Breaker Block."
Subsequently, price breaks downward, creating a "Bearish FVG" that overlaps with this Breaker Block area.
This overlapping area becomes the basis for the short entry.
3. 📊 Additional Features
Visualization: It draws the FVG and Breaker Block zones as boxes on the chart (can be toggled in settings), allowing for visual confirmation of the trade setup.
Backtesting Dashboard: It displays a dashboard in the top-right corner (by default) showing the strategy's cumulative performance (total entries, wins/losses, win rate, total profit).
Summary
This script is a highly specific ICT strategy that uses the "overlap of a Breaker Block and an FVG (the Unicorn Model)" as its sole entry condition. When this condition is met, it transmits an immediately executable order signal to an automated trading bot, complete with all the detailed risk management values preset by the user. It is an "all-in-one" strategy script.

Bollinger Band Screener [Pineify]Multi-Symbol Bollinger Band Screener Pineify – Advanced Multi-Timeframe Market Analysis
Unlock the power of rapid, multi-asset scanning with this original TradingView Pine Script. Expose trends, volatility, and reversals across your favorite tickers—all in a single, customizable dashboard.
Key Features
Screens up to 8 symbols simultaneously with individual controls.
Covers 4 distinct timeframes per symbol for robust, multi-timeframe analysis.
Integrates advanced Bollinger Band logic, adaptable with 11+ moving average types (SMA, EMA, RMA, HMA, WMA, VWMA, TMA, VAR, WWMA, ZLEMA, and TSF).
Visualizes precise state changes: Open/Parallel Uptrends & Downtrends, Consolidation, Breakouts, and more.
Highly interactive table view for instant signal interpretation and actionable alerts.
Flexible to any market: crypto, stocks, forex, indices, and commodities.
How It Works
For each chosen symbol and timeframe, the script calculates Bollinger Bands using your specified source, length, standard deviation, and moving average method.
Real-time state recognition assigns one of several states (Open Rising, Open Falling, Parallel Rising, Parallel Falling), painting the table with unique color codes.
State detection is rigorously defined: e.g., “Open Rising” is set when both bands and the basis rise, indicating strong up momentum.
All bands, signals, and strategies dynamically update as new bars print or user inputs change.
Trading Ideas and Insights
Identify volatility expansions and compressions instantly, spotting breakouts and breakdowns before they play out.
Spot multi-timeframe confluences—when trends align across several TFs, conviction increases for potential trades.
Trade reversals or continuations based on unique Bollinger Band patterns, such as squeeze-break or persistent parallel moves.
Harness this tool for scalping, swing trading, or systematic portfolio screens—your logic, your edge!
How Multiple Indicators Work Together
This screener’s core strength is its integration of multiple moving average types into Bollinger Band construction, not just standard SMA. Each average adapts the bands’ responsiveness to trend and noise, so traders can select the underlying logic that matches their market environment (e.g., HMA for fast moves or ZLEMA for smoothed lag). Overlaying 4 timeframes per symbol ensures trends, reversals, and volatility shifts never slip past your radar. When all MAs and bands synchronize across symbols and TFs, it becomes easy to separate real opportunity from market noise.
Unique Aspects
Perhaps the most flexible Bollinger Band screener for TradingView—choose from over 10 moving average methods.
Powerful multi-timeframe and multi-asset design, rare among Pine scripts.
Immediate visual clarity with color-coded table cells indicating band state—no need for guesswork or chart clutter.
Custom configuration for each asset and time slice to suit any trading style.
How to Use
Add the script to your TradingView chart.
Use the user-friendly input settings to specify up to 8 symbols and 4 timeframes each.
Customize the Bollinger Band parameters: source (price type), band length, standard deviation, and type of moving average.
Interpret the dashboard: Color codes and “state” abbreviations show you instantly which symbols and timeframes are trending, consolidating, or breaking out.
Take trades according to your strategy, using the screener as a confirmation or primary scan tool.
Customization
Fully customize: symbols, timeframes, source, band length, standard deviation multiplier, and moving average type.
Supports intricate watchlists—anything TradingView allows, this script tracks.
Adapt for cryptos, equities, forex, or derivatives by changing symbol inputs.
Conclusion
The Multi-Symbol Bollinger Band Screener “Pineify” is a comprehensive, SEO-optimized Pine Script tool to supercharge your market scanning, trend spotting, and decision-making on TradingView. Whether you trade crypto, stocks, or forex—its fast, intuitive, multi-timeframe dashboard gives you the informational edge to stay ahead of the market.
Try it now to streamline your trading workflow and see all the bands, all the trends, all the time!

CommonUtils█ OVERVIEW
This library is a utility tool for Pine Script™ developers. It provides a collection of helper functions designed to simplify common tasks such as mapping user-friendly string inputs to Pine Script™ constants and formatting timeframe strings for display. The primary goal is to make main scripts cleaner, more readable, and reduce repetitive boilerplate code. It is envisioned as an evolving resource, with potential for new utilities to be added over time based on community needs and feedback.
█ CONCEPTS
The library primarily focuses on two main concepts:
Input Mapping
Pine Script™ often requires specific constants for function parameters (e.g., `line.style_dashed` for line styles, `position.top_center` for table positions). However, presenting these technical constants directly to users in script inputs can be confusing. Input mapping involves:
Allowing users to select options from more descriptive, human-readable strings (e.g., "Dashed", "Top Center") in the script's settings.
Providing functions within this library (e.g., `mapLineStyle`, `mapTablePosition`) that take these user-friendly strings as input.
Internally, these functions use switch statements or similar logic to convert (map) the input string to the corresponding Pine Script™ constant required by built-in functions.
This approach enhances user experience and simplifies the main script's logic by centralizing the mapping process.
Timeframe Formatting
Raw timeframe strings obtained from variables like `timeframe.period` (e.g., "1", "60", "D", "W") or user inputs are not always ideal for direct display in labels or panels. The `formatTimeframe` function addresses this by:
Taking a raw timeframe string as input.
Parsing this string to identify its numerical part and unit (e.g., minutes, hours, days, weeks, months, seconds, milliseconds).
Converting it into a more standardized and readable format (e.g., "1min", "60min", "Daily", "Weekly", "1s", "10M").
Offering an optional `customSuffix` parameter (e.g., " FVG", " Period") to append to the formatted string, making labels more descriptive, especially in multi-timeframe contexts.
The function is designed to correctly interpret various common timeframe notations used in TradingView.
█ NOTES
Ease of Use: The library functions are designed with simple and understandable signatures. They typically take a string input and return the corresponding Pine Script™ constant or a formatted string.
Default Behaviors: Mapping functions (`mapLineStyle`, `mapTablePosition`, `mapTextSize`) generally return a sensible default value (e.g., `line.style_solid` for `mapLineStyle`) in case of a non-matching input. This helps prevent errors in the main script.
Extensibility of Formatting: The `formatTimeframe` function, with its `customSuffix` parameter, allows for flexible customization of timeframe labels to suit the specific descriptive needs of different indicators or contexts.
Performance Considerations: These utility functions primarily use basic string operations and switch statements. For typical use cases, their impact on overall script performance is negligible. However, if a function like `formatTimeframe` were to be called excessively in a loop with dynamic inputs (which is generally not its intended use), performance should be monitored.
No Dependencies: This library is self-contained and does not depend on any other external Pine Script™ libraries.
█ EXPORTED FUNCTIONS
mapLineStyle(styleString)
Maps a user-provided line style string to its corresponding Pine Script™ line style constant.
Parameters:
styleString (simple string) : The input string representing the desired line style (e.g., "Solid", "Dashed", "Dotted" - typically from constants like LS1, LS2, LS3).
Returns: The Pine Script™ constant for the line style (e.g., line.style_solid). Defaults to line.style_solid if no match.
mapTablePosition(positionString)
Maps a user-provided table position string to its corresponding Pine Script™ position constant.
Parameters:
positionString (simple string) : The input string representing the desired table position (e.g., "Top Right", "Top Center" - typically from constants like PP1, PP2).
Returns: The Pine Script™ constant for the table position (e.g., position.top_right). Defaults to position.top_right if no match.
mapTextSize(sizeString)
Maps a user-provided text size string to its corresponding Pine Script™ size constant.
Parameters:
sizeString (simple string) : The input string representing the desired text size (e.g., "Tiny", "Small" - typically from constants like PTS1, PTS2).
Returns: The Pine Script™ constant for the text size (e.g., size.tiny). Defaults to size.small if no match.
formatTimeframe(tfInput, customSuffix)
Formats a raw timeframe string into a more display-friendly string, optionally appending a custom suffix.
Parameters:
tfInput (simple string) : The raw timeframe string from user input or timeframe.period (e.g., "1", "60", "D", "W", "1S", "10M", "2H").
customSuffix (simple string) : An optional suffix to append to the formatted timeframe string (e.g., " FVG", " Period"). Defaults to an empty string.
Returns: The formatted timeframe string (e.g., "1min", "60min", "Daily", "Weekly", "1s", "10min", "2h") with the custom suffix appended.

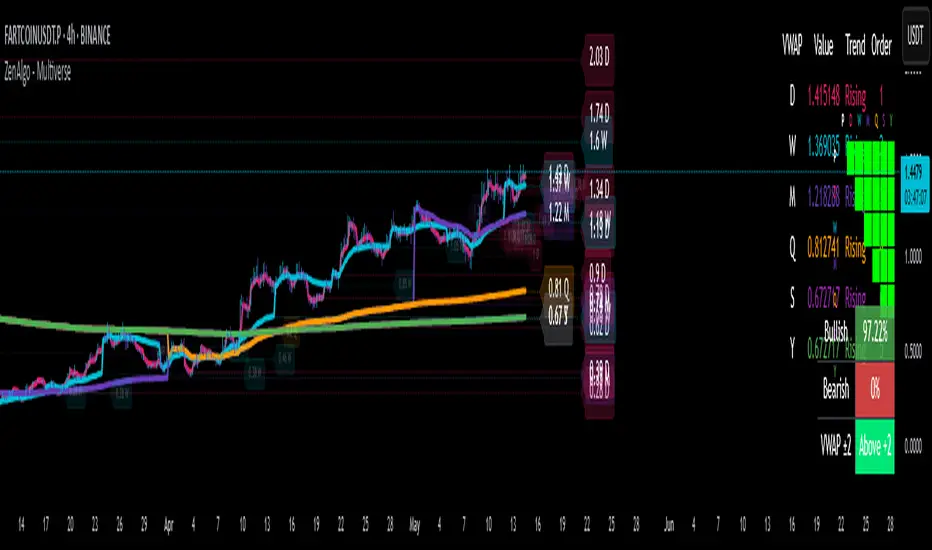
ZenAlgo - MultiverseThe ZenAlgo – Multiverse indicator provides a multi-timeframe view of Volume-Weighted Average Price (VWAP) levels and their dynamic interaction with price across seven defined timeframes: Daily, Weekly, Monthly, Quarterly, Semi-Annual, and Yearly. The indicator is intended to help traders contextualize price within time-based value areas and examine how price interacts with statistically relevant bands derived from those VWAPs.
VWAP Calculation and Period Structure
At the core, this script computes VWAP levels anchored to six distinct timeframes using volume data and a configurable source (default is HLC3). Each VWAP resets at the start of its corresponding period (e.g., Daily VWAP resets at the beginning of a new day) using timeframe.change() as a detection mechanism. This allows each VWAP level to reflect a clean aggregation of price and volume over its specified period.
VWAP levels are only computed if volume data is present and cumulative volume increases, ensuring logical consistency. If volume is missing or inconsistent, the script terminates execution with an error to prevent invalid outputs.
Band Calculation
Each VWAP is accompanied by one or two optional bands on both sides, calculated using percentage-based offset. Daily VWAP is configurable per user preference to use either standard deviation or a percentage-based offset. These bands provide a dynamic value area that expands or contracts with volatility or proportional price distance, respectively.
The bands help classify price as:
Inside the main band (e.g., between ±1 band): near average value
Inside extended band (e.g., ±2 bands): stretched but not extreme
Beyond extended band: potentially overheated or oversold conditions
This layering creates a multi-zoned map of value perception across timeframes.
Labeling and Historical Tracking
As each new VWAP is computed, it is stored in a bounded array alongside metadata such as label position, line objects, test count, and test state (whether price has interacted with it). Each level is drawn as a dotted horizontal line and labeled with its value and corresponding period (e.g., "D", "W", "M").
Price interaction with a VWAP level (i.e., candle high/low crossing the line) changes the styling of the label and line, marking it as "tested." A cap on how many tested levels are retained (default 10) avoids excessive clutter and resource usage.
These persistent horizontal levels give the trader a visual reference of where value was defined in previous periods and how price has respected or ignored those levels over time.
Summary Tables and Grid
Two visual table overlays are provided:
1. VWAP Summary Table , this table shows:
VWAP values per timeframe
Trend interpretation (rising, falling, stable) relative to price
Ranked order of VWAP values (from highest to lowest)
The order is recalculated each bar to reflect the vertical positioning of each VWAP on the price chart.
2. VWAP Relationship Grid
A grid matrix compares each VWAP and current price against all others. Each cell reflects whether a given source is above, below, or within a tolerance threshold relative to another. Colors (green, red, gray) visually encode the result, with the diagonal marked in black and unused cells disabled.
This matrix helps identify alignment or dissonance among timeframes, allowing users to detect whether shorter-term value is leading or lagging longer-term value.
Price Band Classification
For the Daily VWAP specifically, the script includes an extra classification system. It assigns the current price to a zone (e.g., "At VWAP", "Bear Band", "Above Bull Band 2") based on where the price lies in relation to the VWAP bands. This classification is also used for dynamic coloring and added to the daily label.
Display Controls
The script offers fine-grained controls:
Toggle visibility of each VWAP and band group independently
Adjust the offset of labels from the current bar
Customize band multipliers and color transparency
Limit the number of historical VWAP labels plotted
Position both the summary and grid tables flexibly on screen
These options allow traders to declutter their charts and focus on the most relevant context for their strategy.
How to Interpret and Use
This indicator provides a structured view of market value perception across various timeframes. For example:
When price converges with multiple VWAPs, it may suggest consensus on value.
When price moves away from all VWAPs, it may indicate trending or stretched conditions.
Crosses and retests of VWAPs (especially higher-timeframe ones) can act as areas of interest.
The band-based classification helps identify transitional zones and whether price is situated in an area where value is being accepted or rejected.
The summary tables offer a high-level dashboard of price positioning and value structure, which can assist with top-down analysis, filtering setups, or contextual decision-making.
Added Value Compared to Free Alternatives
Most free VWAP scripts:
Cover only a single timeframe (often daily or session-based)
Lack historical level tracking with tested/retested visualization
Do not support grid-level relationships or multi-timeframe band analysis
Offer limited configuration over how bands are calculated or displayed
This script consolidates multiple value areas in one consistent framework and goes further by tracking historical relevance, providing interaction logs, and organizing data into actionable overlays.
For traders seeking comprehensive value context across intraday and swing horizons, this tool offers persistent and structured data views that are otherwise unavailable through individual, isolated VWAP tools.
Limitations and Disclaimers
The indicator depends on volume data. On instruments with unreliable or synthetic volume (e.g., certain spot forex or CFDs), results may not be meaningful.
Band-based interpretation should not be used as a signal mechanism on its own.
On low timeframes, longer-period VWAPs may appear flat or visually compressed.
As with any analytical tool, interpretation requires trader discretion and should be combined with broader context.
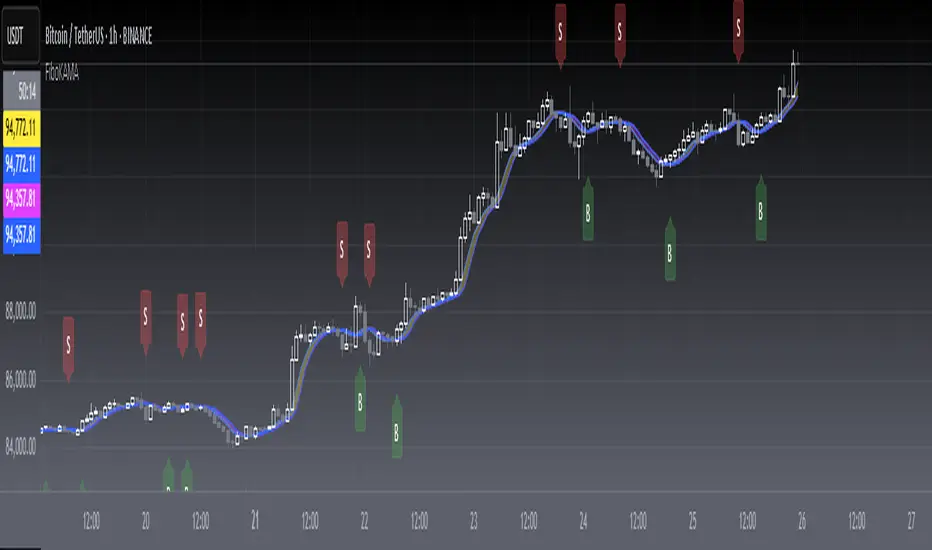
[blackcat] L2 FiboKAMA Adaptive TrendOVERVIEW
The L2 FiboKAMA Adaptive Trend indicator leverages advanced technical analysis techniques by integrating Fibonacci principles with the Kaufman Adaptive Moving Average (KAMA). This combination creates a dynamic and responsive tool designed to adapt seamlessly to changing market conditions. By providing clear buy and sell signals based on adaptive momentum, this indicator helps traders identify potential entry and exit points effectively. Its intuitive design and robust features make it a valuable addition to any trader’s arsenal 📊💹.
According to the principle of Kaufman's Adaptive Moving Average (KAMA), it is a type of moving average line specifically designed for markets with high volatility. Unlike traditional moving averages, KAMA can automatically adjust its period based on market conditions to improve accuracy and responsiveness. This makes it particularly useful for capturing market trends and reducing false signals in varying market environments.
The use of Fibonacci magic numbers (3, 8, 13) enhances the performance and accuracy of KAMA. These numbers have special mathematical properties that align well with the changing trends of KAMA moving averages. Combining them with KAMA can significantly boost its effectiveness, making it a popular choice among traders seeking reliable signals.
This fusion not only smoothens price fluctuations but also ensures quick responses to market changes, offering dependable entry and exit points. Thanks to the flexibility and precision of KAMA combined with Fibonacci magic numbers, traders can better manage risks and aim for higher returns.
FEATURES
Enhanced Kaufman Adaptive Moving Average (KAMA): Incorporates Fibonacci principles for improved adaptability:
Source Price: Allows customization of the price series used for calculation (default: HLCC4).
Fast Length: Determines the period for quicker adjustments to recent price changes.
Slow Length: Sets the period for smoother transitions over longer-term trends.
Dynamic Lines:
KAMA Line: A yellow line representing the primary adaptive moving average, which adapts quickly to new trends.
Trigger Line: A fuchsia line serving as a reference point for detecting crossovers and generating signals.
Visual Cues:
Buy Signals: Green 'B' labels indicating potential buying opportunities.
Sell Signals: Red 'S' labels signaling possible selling points.
Fill Areas: Colored regions between the KAMA and Trigger lines to visually represent trend directions and strength.
Alert Functionality: Generates real-time alerts for both buy and sell signals, ensuring timely notifications for actionable insights 🔔.
Customizable Parameters: Offers flexibility through adjustable inputs, allowing users to tailor the indicator to their specific trading strategies and preferences.
HOW TO USE
Adding the Indicator:
Open your TradingView chart and navigate to the indicators list.
Select L2 FiboKAMA Adaptive Trend and add it to your chart.
Configuring Parameters:
Adjust the Source Price to choose the desired price series (e.g., close, open, high, low).
Set the Fast Length to define how quickly the indicator responds to recent price movements.
Configure the Slow Length to determine the smoothness of long-term trend adaptations.
Interpreting Signals:
Monitor the chart for green 'B' labels indicating buy signals and red 'S' labels for sell signals.
Observe the colored fill areas between the KAMA and Trigger lines to gauge trend strength and direction.
Setting Up Alerts:
Enable alerts within the indicator settings to receive notifications whenever buy or sell signals are triggered.
Customize alert messages and frequencies according to your trading plan.
Combining with Other Tools:
Integrate this indicator with additional technical analysis tools and fundamental research for comprehensive decision-making.
Confirm signals using other indicators like RSI, MACD, or Bollinger Bands for increased reliability.
Optimizing Performance:
Backtest the indicator across various assets and timeframes to understand its behavior under different market conditions.
Fine-tune parameters based on historical performance and current market dynamics.
Integrating Magic Numbers:
Understand the basic principles of KAMA to find suitable entry points for Fibonacci magic numbers.
Utilize the efficiency ratio to measure market volatility and adjust moving average parameters accordingly.
Apply Fibonacci magic numbers (3, 8, 13) to enhance the responsiveness and accuracy of KAMA.
LIMITATIONS
Market Volatility: May produce false signals during periods of extreme volatility or sideways movement.
Parameter Sensitivity: Requires careful tuning of fast and slow lengths to balance responsiveness and stability.
Asset-Specific Behavior: Effectiveness can vary significantly across different financial instruments and time horizons.
Complementary Analysis: Should be used alongside other analytical methods to enhance accuracy and reduce risk.
NOTES
Historical Data: Ensure adequate historical data availability for precise calculations and backtesting.
Demo Testing: Thoroughly test the indicator on demo accounts before deploying it in live trading environments.
Continuous Learning: Stay updated with market trends and continuously refine your strategy incorporating feedback from the indicator's performance.
Risk Management: Always implement proper risk management practices regardless of the signals provided by the indicator.
ADVANCED USAGE TIPS
Multi-Timeframe Analysis: Apply the indicator across multiple timeframes to gain deeper insights into underlying trends.
Divergence Strategy: Look for divergences between price action and the KAMA line to spot potential reversals early.
Volume Integration: Combine volume analysis with the indicator to confirm the strength of identified trends.
Custom Scripting: Modify the script to include additional filters or conditions tailored to your unique trading approach.
IMPROVING KAMA PERFORMANCE
Increase Length: Extend the KAMA length to consider more historical data, reducing the impact of short-term price fluctuations.
Adjust Fast and Slow Lengths: Make KAMA smoother by increasing the fast length and decreasing the slow length.
Use Smoothing Factor: Apply a smoothing factor to control the level of smoothness; typical values range from 0 to 1.
Combine with Other Indicators: Pair KAMA with other smoothing indicators like EMA or SMA for more reliable signals.
Filter Noise: Use filters or other technical analysis tools to eliminate price noise, enhancing KAMA's effectiveness.
ZenAlgo - RangerThe core of the indicator is the daily range, anchored around the 1-minute timeframe VWAP (volume-weighted average price), with ±2 standard deviations defining the upper and lower bounds. This range dynamically forms throughout the day and then gets “locked” at 23:59 each day to establish historical reference values.
The indicator calculates this locked VWAP and standard deviation per day, which serves two primary purposes:
Drawing today's real-time evolving range , updated each minute.
Plotting previous daily ranges , based on historical locked VWAPs and standard deviations, providing visual reference boxes on the chart.
This design enables the trader to identify mean-reversion zones and persistent directional biases based on volume-weighted price consensus.
Multiple Standard Deviation Layers
Beyond the ±2.0 deviation bounds, optional lines are available at half-step increments (e.g., ±0.5, ±1.5, ..., ±4.5) and full-step levels beyond ±2.0 (±3.0, ±4.0, ±5.0). These provide a customizable grid to visualize price extremes, tail behavior, or potential breakout zones relative to volume-adjusted price equilibrium.
Users can enable only the levels they need, offering flexibility depending on their strategy (e.g., scalping versus swing trading).
Historical Range Retention
The script stores up to 70 previous daily VWAP + standard deviation values (adjustable). For each, it draws a full range box and standard deviation lines in the past. This historical context helps in understanding how current price interacts with prior days’ balance zones.
These boxes are always drawn from 00:00 to 23:59 UTC , ensuring consistent alignment across instruments and avoiding session-based discrepancies.
Monday Range Reference (Drawn on Tuesdays)
On Tuesdays, the indicator plots the previous Monday's VWAP-based range across the rest of the week. This serves as a persistent contextual anchor for traders watching weekly unfolding behavior. The range is defined identically (VWAP ±2σ) and drawn from Monday 00:00 through the following Monday.
This method assumes Monday often sets the tone or structure for the week, and tracking this level through time may highlight support/resistance confluence or range expansion scenarios.
Each Monday range is extended over 7 days and includes dashed lines at the 25%, 50%, and 75% marks within the range. These midrange markers help traders assess microstructure behaviors (e.g., reversion to median, failure to hold midpoint, etc.).
Daily Volume Delta via 4H Candles
The indicator also integrates daily buy/sell volume deltas , derived from 4-hour candles of the regular session (non-Heikin Ashi). The logic categorizes volume as:
Buy volume when candle closes above the previous close.
Sell volume when it closes below.
Even split when the candle closes flat.
These volumes accumulate each day to derive net delta (buy - sell). This delta is recorded for each day and can optionally be displayed. A similar process tracks the delta for each Monday range on an ongoing basis.
This information quantifies the market’s aggressive buying vs. selling , correlating with price positions inside or outside the VWAP ranges. A strong delta in one direction may justify a price sustaining above/below VWAP, or diverging from the previous range.
Interpretation and Best Usage Practices
VWAP±2σ Range : Considered a high-probability area for consolidation or reversal. Mean-reverting strategies can benefit from signals within this area.
VWAP±3.0 and beyond : Extreme deviations may signal exhaustion or breakout potential, but are less frequent.
Previous Range Overlap : Overlap of today’s price with past VWAP zones may indicate support/resistance zones.
Monday Range on Tuesday : Persistent levels where the week may repeatedly pivot. Best used on instruments that exhibit weekly cyclical behavior (e.g., indices, forex).
Delta Behavior : Sharp positive or negative delta combined with price outside VWAP bands may suggest initiative participation and potential trend continuation.
Added Value Over Free Alternatives
While many free VWAP tools exist, this script differs in several specific and factual ways:
Anchored 1-minute VWAP lock at a consistent daily timestamp (23:59 UTC), enabling historical analysis.
Historical storage of previous VWAP ranges , with adjustable memory depth and visual continuity.
Flexible standard deviation plotting , down to 0.5 increments, tailored to the user's strategy needs.
Dedicated Monday range analysis , not common in freely available scripts.
Volume delta tracking per day and per Monday range , offering a directional volume view unavailable in standard VWAP implementations.
Persistent and visual interpretation framework using extended boxes and dashed lines for easier contextual navigation.
Each of these additions increases the script’s utility for methodical traders relying on volume-weighted statistics, without requiring additional configuration or external calculations.
Limitations and Disclaimers
VWAP based on 1-minute resolution : The indicator uses minute-level data to calculate daily VWAP and standard deviation. This offers high fidelity on liquid instruments but may produce noisy or unreliable levels on illiquid assets or during periods of low volume. For example, microcap stocks or thinly traded altcoins might not yield stable VWAP centers.
Inferred buy/sell volume : Volume delta is estimated using price movement from one candle to the next (close-to-close logic), rather than actual trade-level aggressor data (which is not accessible via TradingView). This approximation may misclassify volume in choppy or low-volatility environments, especially in assets where price changes do not correlate well with order flow (e.g., crypto during low-volume weekends).
Non-continuous markets and price gaps : For assets that do not trade continuously (e.g., stocks, futures), the VWAP calculation starts fresh every day at 00:00 UTC, regardless of the instrument’s official session start. As a result:
Pre-market/post-market trades may be included in VWAP when analyzing equities, even though they are often excluded in professional VWAP tools.
Opening gaps in equities and futures may distort early VWAP values due to lack of volume context, especially if the previous day's session was already closed when new data begins accumulating.
Weekend gaps in crypto, although less frequent due to 24/7 trading, can still influence delta accumulation if abrupt moves happen during low liquidity periods.
Daily session alignment : The VWAP anchoring and box drawing uses 00:00 UTC to 23:59 UTC windows. For instruments with different official session timings (e.g., US equities, CME futures), this may cause mismatches between expected session VWAPs and the ones shown in this script.
Conclusion
The ZenAlgo – Ranger script offers a systematic visualization of volume-adjusted price behavior, combining statistical VWAP ranges with volume delta overlays. By integrating daily and weekly reference zones, this tool supports structured decision-making in various market environments, particularly for traders prioritizing mean reversion, range expansion, or trend confirmation.

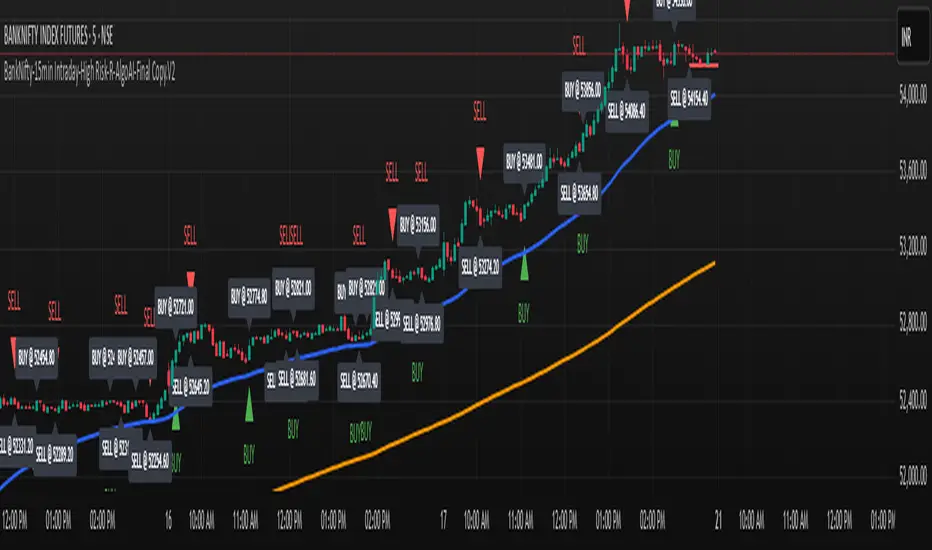
BankNifty-15min Intraday-High Risk-R-AlgoAI-Final Copy// This script is for educational and informational purposes only.
// It does not constitute financial or investment advice.
// Trading involves substantial risk and may not be suitable for all investors.
// Always do your own research or consult with a licensed financial advisor
// before making any trading or investment decisions.
// The author is not responsible for any losses incurred using this script.
⚡ Overview:
This script is a technical indicator designed for intraday trading on the Bank Nifty future chart using the 15-minute timeframe. It uses a combination of normalized buy and sell pressure along with a Hull Moving Average (HMA) smoothing method and volume-based normalization to detect potential buy and sell signals.
💡 Main Concept:
Buy and Sell Pressure Calculation:
The script calculates:
bp (Buy Pressure): close - low
sp (Sell Pressure): high - close
These values are smoothed using a custom Hull Moving Average (HMA) function, designed to reduce lag and react quicker to price changes compared to traditional moving averages.
📊 Normalized Signals:
Buy and Sell pressures are normalized against their HMA smoothed values.
Volume normalization is also applied to adjust for the effect of market activity on the pressure signals.
📌 Signal Logic:
A Buy Signal is generated when:
Only one signal per day is allowed to avoid signal spamming.
A Sell Signal is generated under the opposite conditions:
One sell signal per day.
🧾 Visual Output:
When a signal is triggered, the script:
Draws a horizontal line at the signal price (with labels like BUY @ or SELL @).
Plots triangle markers on the chart to highlight buy (green) or sell (red) signals.
Deletes or extends lines at the end of each day to maintain visual clarity.
📈 Additional Features:
EMA 50 & EMA 200:
Plots two common Exponential Moving Averages (50-period and 200-period) for trend visualization.
⚠️ Important Notes:
This script is meant for educational and research purposes only.
It is designed for high-risk intraday trading.
Signals are based on historical behavior and should not be treated as financial advice.
No stop-loss or take-profit logic is included — traders should manage risk independently.
✅ Summary:
This indicator offers a simple visual and quantitative approach to spot potential intraday turning points for Bank Nifty future on a 15-minute chart, with clear buy and sell markers. It combines volume, price pressure, and moving average smoothing to filter out random price movements.
Dynamic Customizable 50% Line & Daily High/Low + True Day OpenA Unique Indicator for Precise Market-Level Analysis
This indicator is a fully integrated solution that automates complex market-level calculations and visualizations, offering traders a tool that goes beyond the functionality of existing open-source alternatives. By seamlessly combining several trading concepts into a single script, it delivers efficiency, accuracy, and customization that cater to both novice and professional traders.
Key Features: A Breakdown of What Makes It Unique
1. Adaptive Daily Highs and Lows
Automatically detects and plots daily high and low levels based on the selected time frame, dynamically updating in real time.
Features session-based adjustments, allowing traders to focus on levels that matter for specific trading sessions (e.g., London, New York).
Fully customizable styling, visibility, and alerts tailored to each trader’s preferences.
How It Works:
The indicator calculates daily high and low levels directly from price data, integrating session-specific time offsets to account for global trading hours. These levels provide traders with clear visual markers for key liquidity zones.
2. Automated ICT 50% Range Line
A pioneering implementation of ICT’s mid-range concept, this feature dynamically calculates and displays the midpoint of the daily range.
Offers traders a visual guide to identify premium and discount zones, aiding in determining market bias and potential trade setups.
How It Works:
The script calculates the range between the day’s high and low, dividing it by two to generate the midline. This line updates in real-time, ensuring that traders always see the most current premium and discount levels as price action evolves.
3. Dynamic Market Open Levels
Plots session opens (e.g., Asia, London, New York) and the True Day Open to provide actionable reference points for intra-day trading strategies.
Enhances precision in identifying liquidity shifts and aligning trades with institutional price movements.
How It Works:
The indicator uses predefined session times to calculate and display the opening levels for key trading sessions. It dynamically adjusts for time zones, ensuring accuracy regardless of the trader’s location.
4. Custom Watermark for Enhanced Visualization
Includes an optional watermark feature that allows users to display custom text on their charts.
Ideal for personalization, branding, or highlighting session notes without disrupting the clarity of the chart.
Why This Indicator Stands Out
First-to-Market Automation:
While the ICT 50% range line is a widely recognized concept, this is the first script to automate its calculation, combining it with other pivotal trading levels in a single tool.
All-in-One Functionality:
Unlike open-source alternatives that focus on individual features, this script integrates daily highs/lows, mid-range levels, session opens, and customizable watermarks into one cohesive system. The consolidation reduces the need for multiple indicators and ensures a clean, efficient chart setup.
Dynamic Customization:
Every feature can be adjusted to align with a trader’s strategy, time zone, or aesthetic preferences. This level of adaptability is unmatched in existing tools.
Proprietary Logic:
The indicator’s underlying calculations are built from scratch, leveraging advanced programming techniques to ensure accuracy and reliability. These proprietary methods differentiate it from similar open-source scripts.
How to Use This Indicator
Apply the Indicator:
Add it to your TradingView chart from the library.
Configure Settings:
Use the intuitive settings panel to adjust plotted levels, colors, styles, and visibility. Tailor the indicator to your trading strategy.
Incorporate into Analysis:
Combine the plotted levels with your preferred trading approach to identify liquidity zones, establish market bias, and pinpoint potential reversals or entries.
Stay Focused:
With all key levels automated and updated in real time, traders can focus on execution rather than manual plotting.
Originality and Justification for Closed Source
This script is closed-source due to its unique combination of features and proprietary logic that automates complex trading concepts like the ICT 50% range line and session-specific levels. Open-source alternatives lack this level of integration and customization, making this indicator a valuable and original contribution to the TradingView ecosystem.
What Sets It Apart from Open-Source Scripts?
Unlike open-source tools, this indicator doesn’t just replicate individual features—it enhances and integrates them into a seamless, all-in-one solution that offers traders a more efficient and effective way to analyze the market.

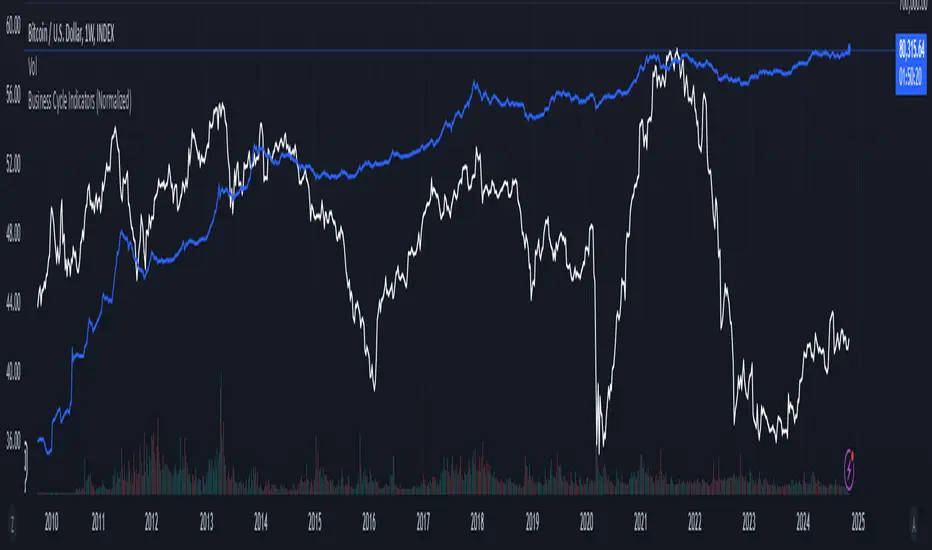
Business Cycle Indicators (Normalized)This script aggregates and normalizes several key economic indicators to provide a comprehensive view of the business cycle and overall market conditions. By combining these indicators into a single, normalized average line, the script helps identify overarching trends and shifts in the economy, aiding in more informed trading and investment decisions.
Included Indicators:
Inverted National Financial Conditions Index (NFCI):
Symbol: FRED:NFCI
Measures financial stress in the markets. An inverted NFCI aligns higher values with positive financial conditions.
Inverted Net Percentage of Banks Tightening Lending Standards (DRTSCIS):
Symbol: FRED:DRTSCIS
Reflects changes in bank lending practices. Inverting this indicator means higher values indicate easing lending standards, which is generally positive for economic growth.
HYG Close Price (iShares High Yield Corporate Bond ETF):
Symbol: AMEX:HYG
Represents the performance of high-yield corporate bonds, providing insight into credit market conditions.
Inverted High-Yield Credit Spread (BAMLH0A0HYM2):
Symbol: FRED:BAMLH0A0HYM2
Measures the spread between high-yield bonds and risk-free securities. A narrower (inverted) spread indicates better market conditions.
Manufacturing/Non-Manufacturing New Orders Ratio:
Symbols: ECONOMICS:USMNO (Manufacturing), ECONOMICS:USNMNO (Non-Manufacturing)
Compares manufacturing to non-manufacturing new orders to gauge shifts in economic activity.
US PMI (Purchasing Managers' Index):
Symbol: ECONOMICS:USBCOI
An indicator of the economic health of the manufacturing sector.
10-Year Inflation Breakeven (T10YIE):
Symbol: FRED:T10YIE
Represents market expectations of inflation over the next ten years.
Inverted 10-Year Real Yield (DFII10):
Symbol: FRED:DFII10
Reflects the real yield on 10-year Treasury Inflation-Protected Securities (TIPS). Inverted to align higher values with positive economic sentiment.
Copper/Gold Ratio:
Symbols: CAPITALCOM:COPPER (Copper), TVC:GOLD (Gold)
Compares the prices of copper and gold, often used as a barometer for global economic activity.
Features:
Normalized Indicators: Each indicator is normalized to a 0-100 scale to facilitate direct comparison, regardless of their original units or scales.
Normalized Average Line: Calculates and plots the average of all available normalized indicators, providing a single line that represents the combined economic signals.
Customizable Display:
Show Individual Indicators: Option to display individual normalized indicators for detailed analysis.
Show Normalized Average Line: Option to display the normalized average line for a consolidated view.
Dynamic Labeling: Displays the latest value of the normalized average directly on the chart for quick reference.
How to Use:
Adding the Script:
Apply the script to a chart in TradingView using a timeframe that aligns with the frequency of the economic data (daily or weekly recommended).
Customization:
Show Normalized Average Line: Enabled by default to display the combined indicator.
Show Individual Indicators: Enable this option in the script settings to display all individual normalized indicators.
Interpretation:
Normalized Scale (0-100): Higher values generally indicate stronger economic conditions, while lower values may suggest weakening conditions.
Trend Analysis: Use the normalized average line to identify trends and potential turning points in the business cycle.
Notes:
Data Availability: Ensure you have access to all the data sources used in the script. Some data feeds may require specific TradingView subscriptions.
Indicator Limitations: Economic indicators are subject to revisions and may not reflect real-time market conditions.
No Investment Advice: This script is a tool for analysis and should not be considered as financial advice. Always conduct your own research before making investment decisions.
Advanced Volume-Driven Breakout SignalsThe "Advanced Volume-Driven Breakout Signals" indicator is a cutting-edge tool designed to help traders identify high-potential trading opportunities through sophisticated volume analysis techniques. This indicator integrates volume flow analysis, moving averages, and Relative Volume (RVOL) to provide a comprehensive view of market conditions, going beyond traditional Volume Spread Analysis (VSA) methods.
Key Features:
Volume Flow Analysis: Distinguishes bullish and bearish volume flows with distinct colors, making it easier to visualize market sentiment and potential breakout points.
Volume Flow Moving Averages: Calculates moving averages for volume using various methods (SMA, EMA, WMA, HMA, VWMA), accommodating different trading strategies. This includes settings for adjusting the type of moving average and its period, as well as thresholds for high, medium, and low volume levels.
Volume Spikes Detection: Identifies significant volume spikes based on user-defined multipliers and moving averages, highlighting unusual trading activity.
Volume MA Cloud Settings: Computes general moving averages of volume to track trends and detect deviations. This feature includes options to select different moving average types and adjust thresholds for detecting high volume activity.
Relative Volume (RVOL): Measures current volume relative to historical averages, triggering signals when RVOL exceeds predefined thresholds, indicating notable changes in trading activity.
Entry Conditions: Provides clear long and short entry signals based on combined volume flow conditions and RVOL, offering actionable trading opportunities.
Volume Visualization:
— Bullish Volume Flow: Light and dark green bars indicate bullish volume flow.
— Bearish Volume Flow: Light and dark red bars denote bearish volume flow.
— High Volume Bars: Highlighted in yellow, and extreme volume bars in orange for additional context. These bars are plotted for visual aid and do not directly influence trade signals, focusing instead on the quality and strength of the volume flow.
Alerts: Allows users to create alert notifications for long and short entry signals when the criteria are met, enabling traders to respond promptly to trading opportunities.
Usage:
Overlay: Apply the indicator directly to your price chart to visualise real-time signals and volume conditions.
Customisable: Adjust settings for moving averages, RVOL, and other parameters to match your trading strategy and preferences.
Comparison to VSA Scripts: The "Advanced Volume-Driven Breakout Signals" indicator extends beyond traditional VSA scripts by incorporating a wider range of analytical features. While VSA primarily focuses on volume spread patterns and price action, this indicator offers enhanced functionality with advanced RVOL metrics, customizable moving averages, and detailed volume spike detection, making it a more versatile tool for identifying breakout opportunities and managing trades. It is particularly effective when used alongside key levels and order blocks.
Acknowledgements: Special thanks to @oh92 and @goofoffgoose for their invaluable scripts, which served as inspiration in the development of this advanced trading indicator.
Notes: The script is continually evolving, with ongoing refinements aimed at enhancing accuracy and performance.

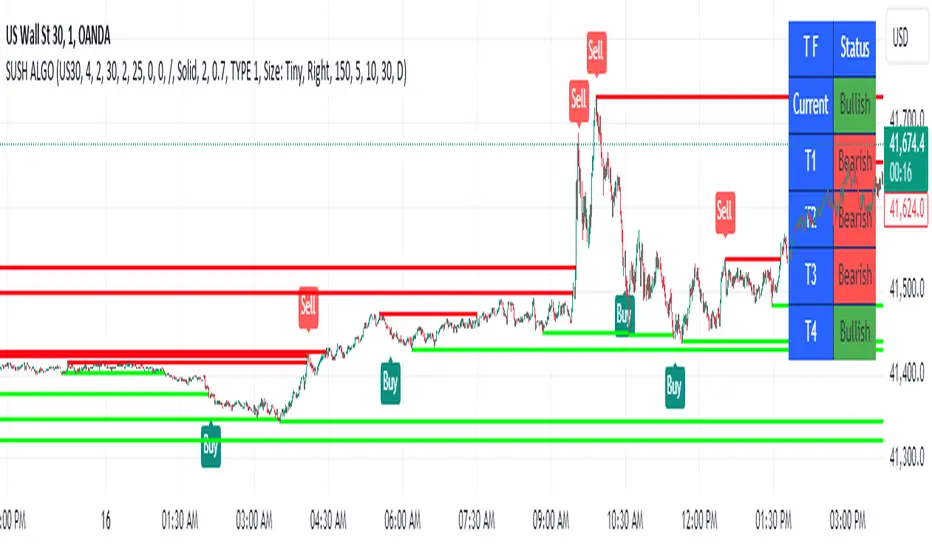
SUSH ALGOStep-by-Step Guide for Trading Using the Script
1. Asset Selection
When applying this script, the first thing to do is select your desired asset to trade.
You can select from the following assets within the script:
Scalping
Gold
USD/JPY
EUR/USD
EUR/JPY
BTC/USD
NIFTY 50
The parameters for the strategy (e.g., q, r, s, and ADX Threshold) will adjust automatically based on your selected asset. If you want to use custom parameters, turn on the Use Manual Settings option.
2. Adjust Manual Settings (Optional)
Use Manual Settings: Toggle this if you want to input your custom values for the strategy parameters.
Manual q: Affects swing period calculation.
Manual r: Affects the smoothing in the calculation of the oscillator.
Manual s: Affects the smoothing period of the main line of the oscillator.
Manual Signal Length: Length of the signal line for generating buy/sell signals.
Manual ADX Threshold: Adjusts the ADX value to filter trades based on trend strength.
3. Reading the SMI (Stochastic Momentum Index) Oscillator
SMI: This indicator oscillates between overbought and oversold levels, signaling potential entry and exit points.
Overbought Level: +30
Oversold Level: -30
The signal line is calculated based on the smoothed SMI value.
A crossover above the signal line in the oversold region (< -30) signals a buy.
A crossunder below the signal line in the overbought region (> +30) signals a sell.
4. Trade Signal Alerts
Buy Signal Alert: Triggered when the SMI crosses over the signal line in the oversold zone, and ADX exceeds the threshold.
Sell Signal Alert: Triggered when the SMI crosses under the signal line in the overbought zone, and ADX exceeds the threshold.
5. Entry, Stop Loss, and Target Levels
Entry Line: The script will plot an entry line at the close price when a buy or sell signal is triggered.
Stop Loss: A stop loss will be set based on the lowest low (for buy signals) or highest high (for sell signals) of the previous candles.
Take Profit Targets:
Target 1 (TP1): 3 times the size of the entry candle.
Target 2 (TP2): 6 times the size of the entry candle.
Target 3 (TP3): 10 times the size of the entry candle.
Make sure the Show Entry, Show Stop Loss, and Show Targets toggles are enabled to visualize these lines on the chart.
6. Monitoring the ADX (Average Directional Index)
The ADX value filters weak signals, ensuring that you trade only in trending markets.
If ADX > adxThreshold, the trend is strong, and the buy or sell signal becomes valid.
If ADX < adxThreshold, the trade signals are ignored to avoid trading in sideways markets.
7. Box, Line, and Label Toggles for Swing Highs/Lows
The script allows you to visualize swing highs and lows for better market context. You can toggle the following options:
Show Boxes: Displays rectangular boxes around the swing highs and lows.
Show Swing Lines: Plots lines at swing highs and lows for visual confirmation of key price levels.
Show Labels: Adds text labels to the swing levels, indicating whether they represent a swing high or low.
8. Customize Appearance (Optional)
You can change the appearance of the boxes, lines, and labels, such as their color, width, and style (solid or dotted), from the Appearance settings.
9. Monitor Volume and Open Interest (Optional)
You can also track volume and open interest (OI) data from various exchanges like Binance and BitMEX to get additional confirmations.
Steps for Trading
1.Select your asset from the drop-down menu based on your trading preferences.
2.Adjust manual settings (optional) if you want to use your own parameters for the strategy.
3.Wait for a buy or sell signal to trigger based on the crossover of the SMI oscillator in the overbought/oversold regions.
4.Once a signal is triggered, check for the plotted entry price, stop loss, and take profit levels on your chart.
5.Monitor the ADX value to ensure that the market is trending strongly.
6.If the trade meets your criteria, enter the trade at the indicated price.
Set your stop loss and take profit orders as indicated by the script.
Key Notes
# This strategy is designed for both trending and mean-reversion markets depending on the asset and the ADX value.
# Make sure to practice proper risk management by adjusting the stop loss and position size based on your risk tolerance.
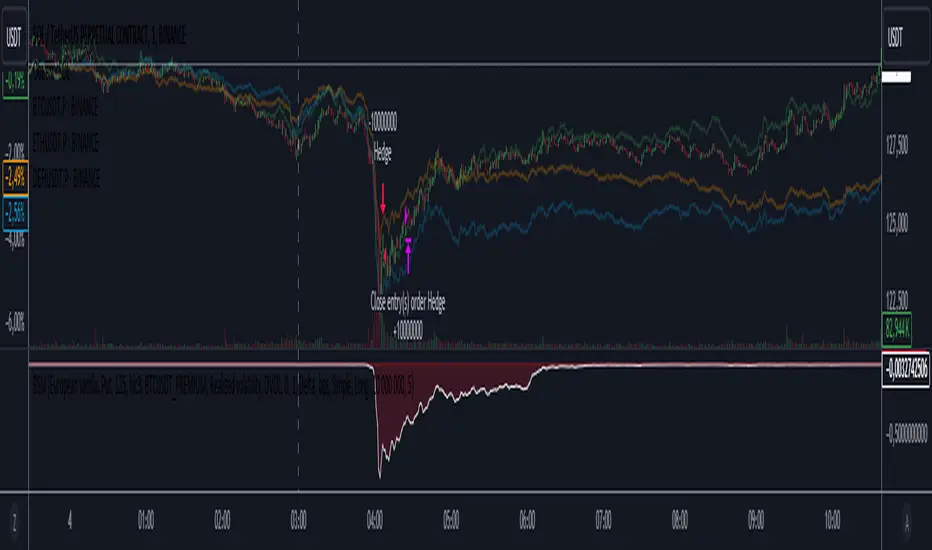
Black-Scholes option price model & delta hedge strategyBlack-Scholes Option Pricing Model Strategy
The strategy is based on the Black-Scholes option pricing model and allows the calculation of option prices, various option metrics (the Greeks), and the creation of synthetic positions through delta hedging.
ATTENTION!
Trading derivative financial instruments involves high risks. The author of the strategy is not responsible for your financial results! The strategy is not self-sufficient for generating profit! It is created exclusively for constructing a synthetic derivative financial instrument. Also, there might be errors in the script, so use it at your own risk! I would appreciate it if you point out any mistakes in the comments! I would be even more grateful if you send the corrected code!
Application Scope
This strategy can be used for delta hedging short positions in sold options. For example, suppose you sold a call option on Bitcoin on the Deribit exchange with a strike price of $60,000 and an expiration date of September 27, 2024. Using this script, you can create a delta hedge to protect against the risk of loss in the option position if the price of Bitcoin rises.
Another example: Suppose you use staking of altcoins in your strategies, for which options are not available. By using this strategy, you can hedge the risk of a price drop (Put option). In this case, you won't lose money if the underlying asset price increases, unlike with a short futures position.
Another example: You received an airdrop, but your tokens will not be fully unlocked soon. Using this script, you can fully hedge your position and preserve their dollar value by the time the tokens are fully unlocked. And you won't fear the underlying asset price increasing, as the loss in the event of a price rise is limited to the option premium you will pay if you rebalance the portfolio.
Of course, this script can also be used for simple directional trading of momentum and mean reversion strategies!
Key Features and Input Parameters
1. Option settings:
- Style of option: "European vanilla", "Binary", "Asian geometric".
- Type of option: "Call" (bet on the rise) or "Put" (bet on the fall).
- Strike price: the option contract price.
- Expiration: the expiry date and time of the option contract.
2. Market statistic settings:
- Type of price source: open, high, low, close, hl2, hlc3, ohlc4, hlcc4 (using hl2, hlc3, ohlc4, hlcc4 allows smoothing the price in more volatile series).
- Risk-free return symbol: the risk-free rate for the market where the underlying asset is traded. For the cryptocurrency market, the return on the funding rate arbitrage strategy is accepted (a special function is written for its calculation based on the Premium Price).
- Volatility calculation model: realized (standard deviation over a moving period), implied (e.g., DVOL or VIX), or custom (you can specify a specific number in the field below). For the cryptocurrency market, the calculation of implied volatility is implemented based on the product of the realized volatility ratio of the considered asset and Bitcoin to the Bitcoin implied volatility index.
- User implied volatility: fixed implied volatility (used if "Custom" is selected in the "Volatility Calculation Method").
3. Display settings:
- Choose metric: what to display on the indicator scale – the price of the underlying asset, the option price, volatility, or Greeks (all are available).
- Measure: bps (basis points), percent. This parameter allows choosing the unit of measurement for the displayed metric (for all except the Greeks).
4. Trading settings:
- Hedge model: None (do not trade, default), Simple (just open a position for the full volume when the strike price is crossed), Synthetic option (creating a synthetic option based on the Black-Scholes model).
- Position side: Long, Short.
- Position size: the number of units of the underlying asset needed to create the option.
- Strategy start time: the moment in time after which the strategy will start working to create a synthetic option.
- Delta hedge interval: the interval in minutes for rebalancing the portfolio. For example, a value of 5 corresponds to rebalancing the portfolio every 5 minutes.
Post scriptum
My strategy based on the SegaRKO model. Many thanks to the author! Unfortunately, I don't have enough reputation points to include a link to the author in the description. You can find the original model via the link in the code, as well as through the search indicators on the charts by entering the name: "Black-Scholes Option Pricing Model". I have significantly improved the model: the calculation of volatility, risk-free rate and time value of the option have been reworked. The code performance has also been significantly optimized. And the most significant change is the execution, with which you can now trade using this script.
[SGM GARCH Volatility]I'm excited to share with you a Pine Script™ that I developed to analyze GARCH (Generalized Autoregressive Conditional Heteroskedasticity) volatility. This script allows you to calculate and plot GARCH volatility on TradingView. Let's see together how it works!
Introduction
Volatility is a key concept in finance that measures the variation in prices of a financial asset. The GARCH model is a statistical method that predicts future volatility based on past volatilities and prediction residuals (errors).
Indicator settings
We define several parameters for our indicator:
length = input.int(20, title="Length")
p = input.int(1, title="Lag order (p)")
q = input.int(1, title="Degree of moving average (q)")
cluster_value = input(0.2,title="cluster value")
length: The period used for the calculations, default 20.
p: The order of the delay for the GARCH model.
q: The degree of the moving average for the GARCH model.
cluster_value: A threshold value used to color the graph.
Calculation of logarithmic returns
We calculate logarithmic returns to capture price changes:
logReturns = math.log(close) - math.log(close )
Initializing arrays
We initialize arrays to store residuals and volatilities:
var float residuals = array.new_float(length, 0)
var float volatilities = array.new_float(length, 0)
We add the new logarithmic returns to the tables and keep their size constant:
array.unshift(residuals, logReturns)
if (array.size(residuals) > length)
array.pop(residuals)
We then calculate the mean and variance of the residuals:
meanResidual = array.avg(residuals)
varianceResidual = array.stdev(residuals, meanResidual)
volatility = math.sqrt(varianceResidual)
We update the volatility table with the new value:
array.unshift(volatilities, volatility)
if (array.size(volatilities) > length)
array.pop(volatilities)
GARCH volatility is calculated from accumulated data:
var float garchVolatility = na
if (array.size(volatilities) >= length and array.size(residuals) >= length)
alpha = 0.1 // Alpha coefficient
beta = 0.85 // Beta coefficient
omega = 0.01 // Omega constant
sumVolatility = 0.0
for i = 0 to p-1
sumVolatility := sumVolatility + beta * math.pow(array.get(volatilities, i), 2)
sumResiduals = 0.0
for j = 0 to q-1
sumResiduals := sumResiduals + alpha * math.pow(array.get(residuals, j), 2)
garchVolatility := math.sqrt(omega + sumVolatility + sumResiduals)
Plot GARCH volatility
We finally plot the GARCH volatility on the chart and add horizontal lines for easier visual analysis:
plt = plot(garchVolatility, title="GARCH Volatility", color=color.rgb(33, 149, 243, 100))
h1 = hline(0.1)
h2 = plot(cluster_value)
h3 = hline(0.3)
colorGarch = garchVolatility > cluster_value ? color.red: color.green
fill(plt, h2, color = colorGarch)
colorGarch: Determines the fill color based on the comparison between garchVolatility and cluster_value.
Using the script in your trading
Incorporating this Pine Script™ into your trading strategy can provide you with a better understanding of market volatility and help you make more informed decisions. Here are some ways to use this script:
Identification of periods of high volatility:
When the GARCH volatility is greater than the cluster value (cluster_value), it indicates a period of high volatility. Traders can use this information to avoid taking large positions or to adjust their risk management strategies.
Anticipation of price movements:
An increase in volatility can often precede significant price movements. By monitoring GARCH volatility spikes, traders can prepare for potential market reversals or accelerations.
Optimization of entry and exit points:
By using GARCH volatility, traders can better identify favorable times to enter or exit a position. For example, entering a position when volatility begins to decrease after a peak can be an effective strategy.
Adjustment of stops and objectives:
Since volatility is an indicator of the magnitude of price fluctuations, traders can adjust their stop-loss and take-profit orders accordingly. Periods of high volatility may require wider stops to avoid being exited from a position prematurely.
That's it for the detailed explanation of this Pine Script™ script. Don’t hesitate to use it, adapt it to your needs and share your feedback! Happy analysis and trading everyone!

Dynamic Cycle Oscillator [Quantigenics]This script is designed to navigate through the ebbs and flows of financial markets. At its core, this script is a sophisticated yet user-friendly tool that helps you identify potential market turning points and trend continuations.
How It Works:
The script operates by plotting two distinct lines and a central histogram that collectively form a band structure: a center line and two outer boundaries, indicating overbought and oversold conditions. The lines are calculated based on a blend of exponential moving averages, which are then refined by a root mean square (RMS) over a specified number of bars to establish the cyclic envelope.
The input parameters:
Fast and Slow Periods:
These determine the sensitivity of the script. Shorter periods react quicker to price changes, while longer periods offer a smoother view.
RMS Length:
This parameter controls the range of the cyclic envelope, influencing the trigger levels for trading signals.
Using the Script:
On your chart, you’ll notice how the Dynamic Cycle Oscillator’s lines and histogram weave through the price action. Here’s how to interpret the movements.
Breakouts and Continuations:
Buy Signal: Consider a long position when the histogram crosses above the upper boundary. This suggests a possible strong bullish run.
Sell Signal: Consider a short position when the histogram crosses below the lower boundary. This suggests a possible strong bearish run.
Reversals:
Buy Signal: Consider a long position when the histogram crosses above the lower boundary. This suggests an oversold market turning bullish.
Sell Signal: Consider a short position when the histogram crosses below the upper boundary. This implies an overbought market turning bearish.
The script’s real-time analysis can serve as a robust addition to your trading strategy, offering clarity in choppy markets and an edge in trend-following systems.
Thanks! Hope you enjoy!
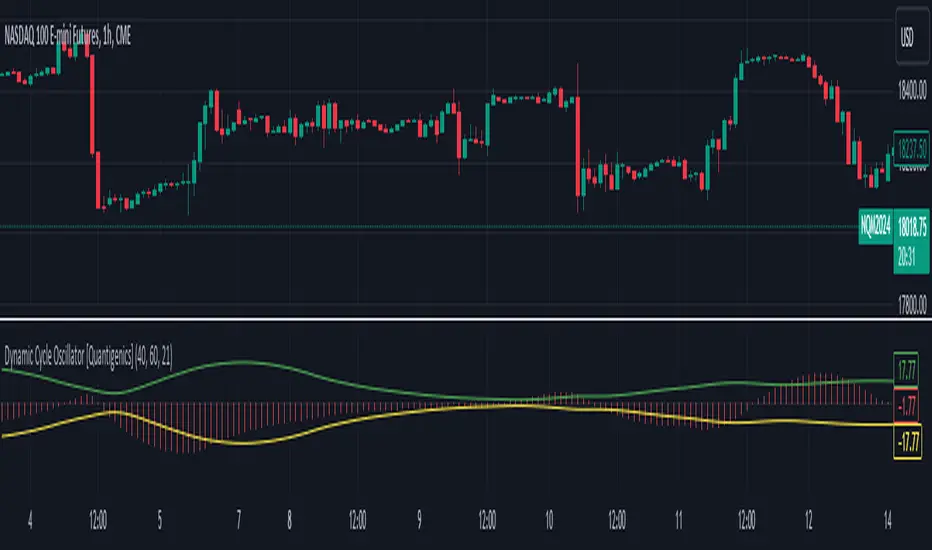
Triple MA HTF Indicator - Dynamic SmoothingThe indicator version of the "Triple MA HTF Strategy - Dynamic Smoothing" strategy script. In summary the indicator consist of 3 higher time frame moving averages. In which the highest timeframe is used for confirmation on the trend (filter). Moving average 1 and 2 are used to enter and exit the trade (crossover / crossunder). The main principle is to detect momentum when the faster MA 1 crosses the slower MA 2 and only trade with the trend (MA3). The dynamic smoothing in the code makes the indicator suitable to trade on lower tramecharts. The indicator script comes with the following features:
options for different types of MA.
options to choose from different timeframes & select # bars of that timeframe to calculate the MA value.
visualizations of the MA using Dynamic Smoothing calculations on lower timecharts. Note that the chart opened should be lower than the selected timeframes in the configurations.
Alerts for entry long, shorts and exits.
For more details on the script and possibility for backtesting the Triple MA HTF indicator I refer to my earlier published strategy script:

Buy Sell Volume SeparateDescription:
The script is designed to provide traders with a unique and comprehensive analysis of trading volume dynamics. Unlike existing scripts, the script offers a distinct advantage by presenting both buy and sell volumes on separate scales, simplifying trading decisions.
Key Features:
1. Dual Volume Scales: The script provides two separate volume scales, one for buy volumes and another for sell volumes. This separation allows to easily distinguish between buying and selling pressure, aiding in more precise trade entries and exits.
2. Clear and Intuitive Chart: The script ensures that the chart it generates is clean and easy to understand. The buy and sell volumes are color-coded for clarity, and you can quickly identify significant volume spikes and trends.
How to Use:
1. Adding the Script: To use the script, simply add it to your TradingView chart.
2. Interpreting Buy and Sell Volumes: On the chart, you will see two separate volume scales—one for buy volumes and one for sell volumes. Green bars represent buying pressure, while red bars indicate selling pressure. Pay attention to the relative strengths and patterns of these bars to gauge market sentiment.
3. Informed Trading Decisions: Armed with insights into both buy and sell volumes, you can make more informed trading decisions. Look for divergences, patterns, or significant volume spikes to identify potential entry and exit points.

Risk Management and Positionsize - MACD exampleMastering Risk Management
Risk management is the cornerstone of successful trading, and it's often the difference between turning a profit and suffering a loss. In light of its importance, I share a risk management tool which you can use for your trading strategies. The script not only assists in position sizing but also comes with built-in technical features that help in market timing. Let's delve into the nitty-gritty details.
Input Parameter: MarginFactor
One of the key features of the script is the MarginFactor input parameter. This element lets you control the portion of your equity used for placing each trade. A MarginFactor of -0.5 means 50% of your total equity will be deployed in placing the position size. Although Tradingview has a built-in option to adjust position sizing in a same way, I personally prefer to have the logic in my pinecode script. The main reason is userexperience in managing and testing different settings for different charts, timeframes and instruments (with the same strategy).
Stoploss and MarginFactor
If your strategy has a 4% stop-loss, you can choose to use only 50% of your equity by setting the MarginFactor to -0.5. In this case, you are effectively risking only 2% of your total capital per trade, which aligns well with the widely-accepted rule of thumb suggesting a 1-2% risk per trade. Similar if your stoploss is only 1% you can choose to change the MarginFactor to 1, resulting in a positionsize of 200% of your equity. The total risk would be again 2% per trade if your stoploss is set to 1%.
Max Drawdown and MarginFactor
Your MarginFactor setting can also be aligned with the maximum drawdown of your strategy, seen during a backtested period of 2-3 years. For example, if the max drawdown is 15%, you could calibrate your MarginFactor accordingly to limit your risk exposure.
Option to Toggle Number of Contracts
The script offers the option to toggle between using a percentage of equity for position sizing or specifying a fixed number of contracts. Utilizing a percentage of equity might yield unrealistic backtest results, especially over longer periods. This occurs because as the capital grows, the absolute position size also increases, potentially inflating the accumulated returns generated by the backtester. On the other hand, setting a fixed number of contracts as your position size offers a more stable and realistic ROI over the backtested period, as it removes the compounding effect on position sizes.
Key Features Strategy
MACD High Time Frame Entry and Exit Logic
The strategy employs a high time frame MACD (Moving Average Convergence Divergence) to make entry and exit decisions. You can easily adjust the timeframe settings and MACD settings in the inputsection to trade on lower timeframes. For more information on the HTF MACD with dynamic smoothing see:
Moving Average High Time Frame Filter
To reduce market 'noise', the strategy incorporates a high time frame moving average filter. This ensures that the trades are aligned with the dominant market trend (trading the trend). In the inputsection traders can easily switch between different type of moving averages. For more information about this HTF filter see:
Dynamic Smoothing
The script includes a feature for dynamic smoothing. The script contains The timeframeToMinutes(tf) function to convert any given time frame into its equivalent in minutes. For example, a daily (D) time frame is converted into 1440 minutes, a weekly (W) into 10,080 minutes, and so forth. Next the smoothing factor is calculated by dividing the minutes of the higher time frame by those of the current time frame. Finally, the script applies a Simple Moving Average (SMA) over the MACD, SIGNAL, and HIST values, MA filter using the dynamically calculated smoothing factor.
User Convenience: One of the major benefits is that traders don't need to manually adjust the smoothing factor when switching between different time frames. The script does this dynamically.
Visual Consistency: Dynamic smoothing helps traders to more accurately visualize and interpret HTF indicators when trading on lower time frames.
Time Frame Restriction: It's crucial to note that the operational time frame should always be lower than the time frame selected in the input sections for dynamic smoothing to function as intended.
By incorporating this dynamic smoothing logic, the script offers traders a nuanced yet straightforward way to adapt High Time Frame indicators for lower time frame trading, enhancing both adaptability and user experience.
Limitations: Exit Strategy
It's crucial to note that the script comes with a simplified exit strategy, devoid of features like a stop-loss, trailing stop-loss or multiple take profits. This means that while the script focuses on entries and risk management, it might result in higher losses if market conditions unexpectedly turn unfavorable.
Conclusion
Effective risk management is pivotal for trading success, and this TradingView script is designed to give you a better idea how to implement positions sizing with your preferred strategy. However, it's essential to note that this tool should not be considered financial advice. Always perform your due diligence and consult with financial advisors before making any trading decisions.
Feel free to use this risk management tool as building block in your trading scripts, Happy Trading!
